Sailors have a love hate relationship with the wind. We are a picky bunch, not enough wind can have you floating around at the mercy of the tide (and your motor), too much and life just becomes down right dangerous, and that is even before we start talking about which direction it is coming from!
So what is the wind anyway…?
Basically speaking wind is the horizontal movement of air that is moving around due to the forces acting upon it. Wind that is in a high pressure system moves towards the area of low pressure, and this in turn causes wind. Wind is also caused by variations of temperature.
Common Wind Terminology
- Gust – a momentary increase in wind speed which lasts for a few seconds
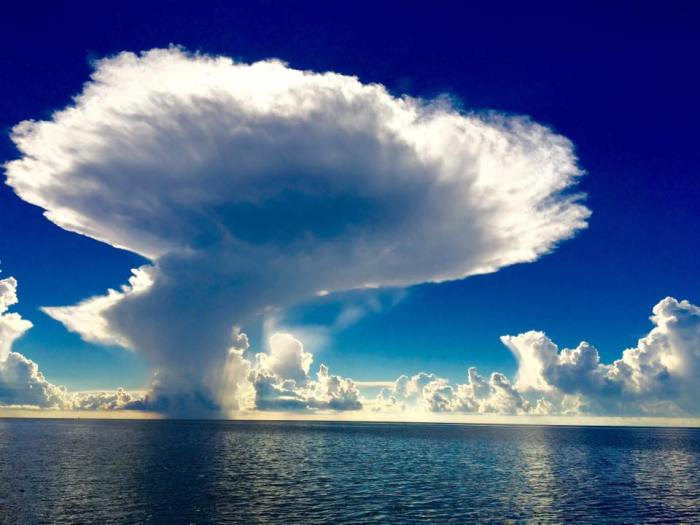
- Squall – a rapid increase in wind speed of at least 16kts and direction which lasts for a number of minutes and then dies away. Common in fronts. Can be identified by the approach of cumulus clouds
- Lull – a decrease in wind speed lasting less than a few minutes
- Gale – average surface wind greater than 34kts – or gusts greater than 43kts
- Hurricane – average surface wind is greater than 63kts
- Funnel effect – wind flow that is forced in to a confined space, such as Cook Strait or Lyttelton Harbour. This causes the wind to speed up.
- True Wind – the wind that is actually blowing
- Apparent Wind – the wind that you feel when you are moving through the air (increases and changes direction from the True wind depending on your speed)
Isobars are lines of equal pressure surrounding high or low pressure systems. Mr Buys-Ballot a Dutch Meteorologist discovered that if you Look in to the wind the Low pressure is on your Left. (Or on your right if you are in the Northern Hemisphere).
Wind follows the isobars. In the Southern Hemisphere wind flows clockwise around the lows and anti-clockwise around the highs (and its the opposite in the Northern Hemisphere). The closer the isobars, the stronger the wind.
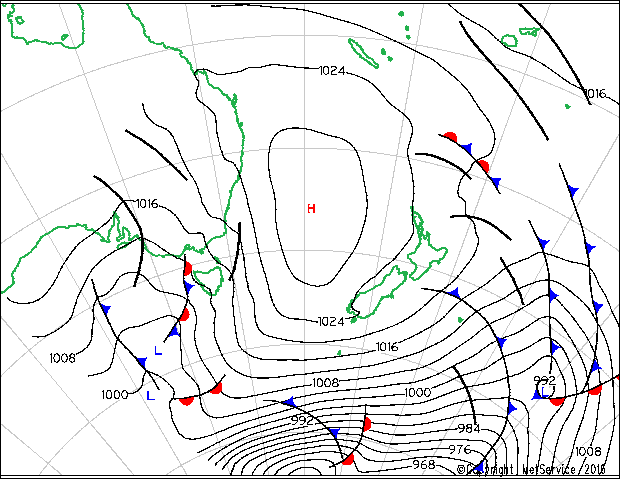
I expect its pretty windy to the South of NZ in this chart!
You can actually measure the wind speed from a synoptic chart like the one above. Using a set of dividers, measure the distance between the isobars. Then estimate the distance in miles between that measurement – one degree of latitude = 60 nautical miles. Use that number and your latitude in to the geostrophic wind scale to get your geostrophic wind speed.
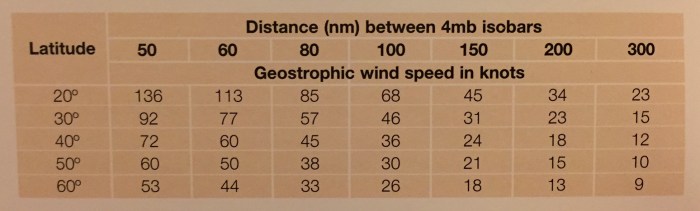
You then make some adjustments as follows:
- Air around low pressure systems slows down around tight corners by 10-25%
- Air around high pressure systems speeds up around tight corners by 10-25%
This gives you the gradient wind speed
Then you need to modify the figure again to allow for the effects of surface friction. This varies depending on the stability of the atmosphere. Over the sea this means multiplying the gradient speed by 0.75 for stable and 0.90 for unstable air and veering 20º for stable and 15º for unstable air.
(Ok that’s a bit too much maths for my liking, but there you go…)
In the tropics, for a given isobar spacing, winds are usually stronger in the tropical or low latitudes than for higher latitudes – so the same spaced isobar lines in the tropics produce stronger winds than in NZ.
In temperate latitudes, the winds tend to follow the direction of the isobars, however in the tropics, the direction of global wind circulation patterns predominate, except where there are significant areas of low pressure.
An area of deepening low pressure can cause a weather bomb or squash zone. This deepening pressure system adds more isobars to the centre of the depression and this causes strong winds.
Wind Direction
We describe the wind in terms of it’s speed and direction. The direction of the wind is described as where it is blowing from – i.e. a Southerly wind comes from the South. This is different to currents which are described in the direction they are going to. So a Southerly wind and a northerly current are both actually travelling in the same direction…
When the wind changes direction, it is called backing & veering. If the wind changes in a clockwise direction then it is said to VEER. If it changes in an an anticlockwise direction then it is said to BACK.
 What no wind looks like
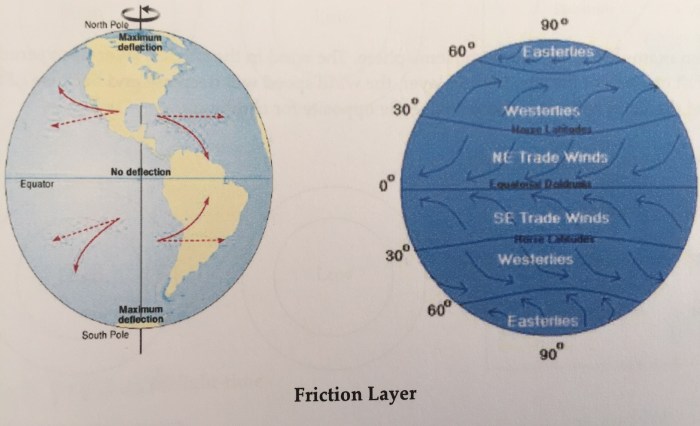
Coriolis Force
The Coriolis Force is caused by the tilt and rotation of the earth. This force causes a deflection to the right in the Northern Hemisphere and so the left in the Southern Hemisphere.
Due to drag caused by friction from the Earth’s surface the wind is slowed down – this is called the friction layer. Land causes more friction than the sea – this means that the wind speed is decreased over land compared to the sea.
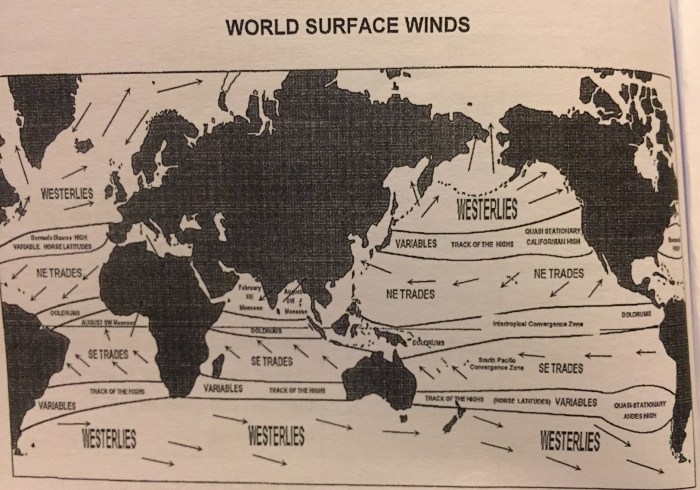
The Coriolis force also causes the North Easterly Trade winds in the Northern Hemisphere and South Easterlies in the Southern Hemisphere. These winds blow consistently in a belt around the ‘doldrums’ or Intertropical Convergence Zone – ITCZ. On average they blow around force 4-5 (see below) and have pleasant weather, blue skies and fluffy cumulus clouds. The barometric pressure is usually steady and if there is any dramatic change in barometric pressure a tropical disturbance can be expected.
The trade wind belt moves north and south during the year – this is caused by the movement of the sun.
Intertropical Convergence Zone – ITCZ
The Intertropical Convergence Zone ITCZ is an area of low pressure lying between the trade wind areas in the two hemispheres. It us also referred to as the equatorial trough or the doldrums. The winds in this area are light or non-existent. The temperature is very hot. There are occasional squalls and sometimes violent thunderstorms which can cause heavy rain. The location of the ITCZ varies backwards and forwards over the equator following the sun’s zenith. This is more pronounced over the land than over the ocean.
Squalls can be identified by a heavy band of cumulonimbus clouds. Beneath the clouds can be strong winds averaging 25-30 kts but they can be stronger usually from an Easterly direction. They are accompanied by heavy rain. They usually last for around 30 minutes. The barometer does not indicate their approach but they can be seen on radar. It is a good idea in areas where squalls are common to reduce sail at night when you can’t see the squalls approaching.
 Clouds in the Florida Keys. Photo by Jennifer MacLean from Sunshine Coast Adventures.
Horse Latitudes
Between the latitudes of 25º-35º North or South on the pole side of the trade winds, lays an area of variable winds. This is called the horse latitudes. They were named due to sailing ships being stalled in this area who were sometimes forced to kill the animals on board due to the shortage of drinking water.
Westerlies
Beyond the Horse Latitudes – 35º North or South lay areas of prevailing Westerlies. They are more prevalent in the Southern Hemisphere due to the lack of land masses to stop their progression around the globe. New Zealand lays in this belt.
Semi-permanent anticyclones are situated in the South Indian Ocean and in the South East Pacific. Between these areas are migratory anticyclones moving from West to East across the Tasman Sea and on to NZ. Between them are bands of low pressure or troughs that extend from the trade winds down to the strong Westerlies in the Southern Ocean below NZ.
Wind Speed Measurement
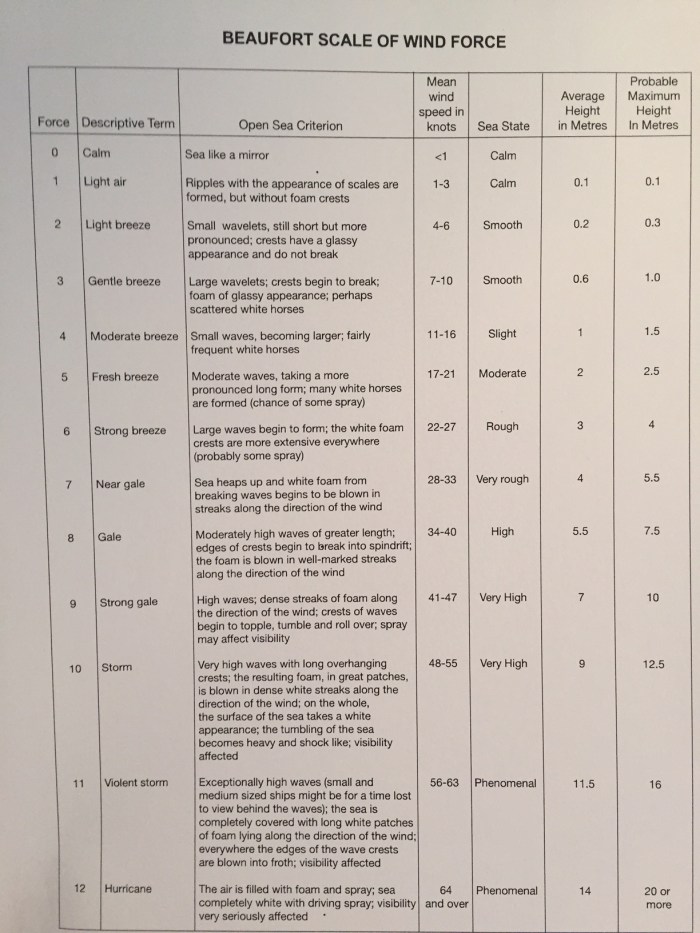
Sailors also like to refer to wind in knots – or nautical miles per hour. Land based weather reports here in NZ are read in km/hr, but marine forecasts are in knots, so that can get a bit confusing. Many boats now have wind speed and direction indicators, but on Wildy we don’t have that, so we just take a guess, and there are various ways to estimate this – using the Beaufort scale is one way.
Back in the early 1800’s Francis Beaufort, a hydrographer for the Royal Navy, created a scale for indicating wind force. By using his description of what the sea conditions are like, and from past experience we can get a pretty good idea of what the wind speed is.
We use the Lyttelton Port Company weather station to tell what the actual current conditions are like in the harbour without having to go over and look for ourselves. Many Ports will have similar information on their website to assist ships when they are coming in and out.
Local Winds
The effects of land can cause varying winds as well. There are many different variations around the world.
Sea Breeze
During the day, then land heats up more quickly than the sea. The air over the land heats up and rises creating a lower pressure area than compared to the sea. Cool moist air then moves in from the sea. This can create fair weather cumulus clouds. The strength of the breeze is at its greatest when the temperature difference between the land and the sea is at its greatest. It usually eases off at night.
Land Breeze
This is the opposite of a sea breeze and occurs at night when the land cools down. The sea retains its heat a lot more easily than the land does, so the warm air above the sea rises, and is replaced by the cooler air over the land. There isn’t usually any clouds associated with a land breeze as the air is usually dry.
Anabatic Wind
These are mountain breezes caused by the sun heating up the sides of the mountains during the day. These are usually weak winds with the wind blowing up the valley.
Katabatibc Wind
This is the opposite of Anabatic. The cool mountain surface causes the air to subside down the slopes. This is especially apparent in steep icy terrain on clear nights. They can be quite strong and occur at night.
Fohn Wind
We get a lot of these winds here in Canterbury. Moisture laden air from the Tasman Sea is pushed up over the Southern Alps. As it is forced up the air cools and riches its dew point, condenses and rains heavily on the windward side of the mountains. It then reaches the top of the mountain and the now dry air subsides with turbulence down the other side, warming on the way through. This creates a warm day in Christchurch but with a very strong and blustery nor-wester wind. This wind usually precedes a cold front. These winds can sometimes produce lenticular clouds which is an indication of gusty wind conditions.
Monsoon
Common in the Indian Ocean and West Pacific Ocean, monsoon winds are seasonal and blow consistently from one direction for a season, and then change to blowing with equal consistency from the opposite direction.
El Nino, Neutral & La Nina
El Nino is a naturally occurring global climate cycle which has consequences for the entire globe. They switch around every two to seven years.
El Niño typically leads to much wetter and stormier conditions than usual in the eastern Pacific, particularly in coastal Peru and Ecuador, and much drier than normal conditions in the western Pacific.
Generally, more — and more intense — cyclones affect the southwest Pacific from Vanuatu east to French Polynesia, while fewer than normal affect Indonesia, Papua New Guinea and Australia.
This video gives a great explanation of how it all works
Tropical Revolving Storms
These storms are destructive, seasonal and localised and have got a whole blog post of their own! Click here to read more – or follow the link at the bottom of this post.
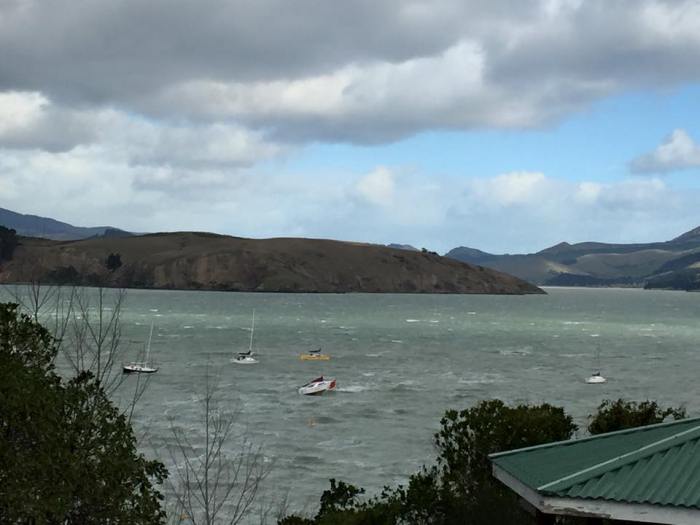 A strong southerly in Lyttelton Harbour
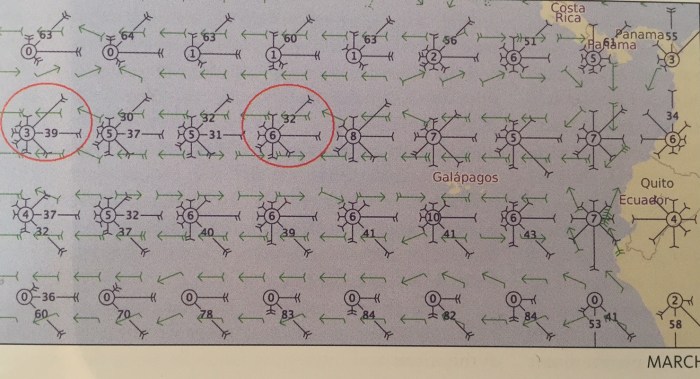
Pilot Charts
Pilot charts can be handy when planning a voyage. The data has been compiled over many years and are based on observations from ship captains of the prevailing average conditions for each month of the year. You can find some excellent charts in Jimmy Cornell’s book – World Voyage Planner. There is a different chart for each month of the year.
The wind roses are located in an area of 5º square. Each rose shows the distribution of the winds that prevail in that area from eight cardinal points. The arrows fly with the wind and their lengths show the percentage of the total number of observations in which the wind has blown from that cardinal point. The number of feathers on the arrow shows the force of the wind on the Beaufort scale – i.e. 4 feathers represents force 4 – see scale above. When the wind blows mainly from one direction the resulting arrow would be too long, so the % is shown numerically on the shaft of the arrow.
The figure in the centre gives the % of calms in blue or the % of storms in red – which ever is greater.
Ocean currents are shown in green arrows indicating their prevailing direction and rate is reflected in the feathers with each being equivalent to 0.25 kts (i.e. an arrow with four feathers = 1 kt of current) Variable currents with no single direction are shown as dotted lines.
So you can see from the circled areas in the below photo in March, in the central Eastern Pacific the winds are prevailing from the East and North East – around force 3 = with 3% or 6% chance of calms, with a Westerly current of around 0.75 knots
Weather Forecasts
We also use Predict Wind to get our wind forecasts. They have all sorts of added extras you can pay for including passage planning tools and that kind of thing.
Windyty produces great wind graphics as well. We also use MetVuw. Everyone has their favourites. We usually wait until one forecast tells us what we want it to say and then roll with that… its interesting how different they can all be. I’ll write more about that in another post.
We have certainly had our fair share of hair-raising wind experiences. Here in the South Island of NZ we are located in the “Roaring Forties” latitudes, so I am hoping that our experiences sailing here will set us in good stead for our adventures ahead.
You can read more of my meteorology course posts here:
- Clouds
- Atmospheric Pressure
- Atmospheric Moisture
- Ocean Currents
- Tropical Revolving Storms
- Weather forecasts
- Fog
Tell me your crazy weather stories!


Crazy weather stories? Where? Here?… not enough space (lol).
We all have our local monsters. Here in the Aegean sea we have the Meltemi winds in the summer. It’ll blow non stop over 20knots for a week, stop for a day or two, and start up for another week. Most annoying! It’s not so much the wind, but the close packed waves….big ones!
I’ve read about many world voyagers avoiding this area just for that reason! Some years are better than others. This summer, to put it bluntly…. sucked!
LikeLiked by 1 person
I’ve heard of that wind. What causes it? Does it always come from the same direction?
LikeLike
Yup. Basically northerlies. A low sits on Cyprus, a high over the Balkans and it funnels down. Lots of rocks and islands with deep waters in between really turn the place into a washing machine!
LikeLiked by 1 person
Pingback: Meteorology – Clouds | Astrolabe Sailing
Pingback: Meteorology – Atmospheric Moisture | Astrolabe Sailing
Pingback: Coastal Skipper | Astrolabe Sailing
Pingback: Meteorology – Tropical Revolving Storms | Astrolabe Sailing
Pingback: Ocean Yachtmaster | Astrolabe Sailing
Pingback: Meteorology – Weather Forecasts | Astrolabe Sailing
Pingback: RYA Offshore Yachtmaster | Astrolabe Sailing