A special thanks to everyone who is still reading my numerous Coastal Skipper revision posts in preparation for the Ocean Yachtmaster exam. I have certainly dredged up some things from the depths of my brain that had long been forgotten.
I am flitting around with topics all over the place, which is just typical of my personality. So while I am doing a bit of Meteorology here, and a bit of Navigation there, what I am really doing is procrastinating about having to study the Celestial Navigation stuff again. I figure if I leave that bit till last then it will be fresh in my mind when I do actually sit the exam.
If you would like to do a proper online navigation course, I can highly recommend: https://sistershiptraining.com
So if you are a bit rusty on your navigation skills, or if you are just beginning, then hopefully you will enjoy this post. Lets go right back to the beginning:
Longitude and Latitude
To be able to describe your position anywhere in the world, you can use Latitude and Longitude. These numbers relate to a grid pattern on the earth.
Latitude is described in degrees, minutes and decimals of a minute either North or South of the Equator – the Equator is 0º and the poles are 90º North or South.
Longitude is described in degrees either East or West of Greenwich – Greenwich is known as the Prime Meridian. East covers most most of Europe, Africa, Asia, Australia, New Zealand and half the Pacific. West covers most of the UK, Spain, the West Coast of Africa, the Atlantic, The Americas and the other half of the Pacific.
Longitude lines are meridians and great circles – i.e. each one directs the earth in half. Whereas Latitude lines are like slices of the earth. You can read more about great circles and their relevance here.
Latitude is always written first. The position is given in degrees, minutes and decimals of a minute.
Here in Christchurch New Zealand we are located at 43º53.2’S, 173º63.6’E.
So if you know that the latitude is South and the longitude is East – then you can automatically know that the position is somewhere in the Southern Hemisphere – somewhere between Africa, Australia and New Zealand – ish.
If you know that the latitude is North and the Longitude is West – then the position is somewhere in the Northern Hemisphere between the UK, America and Hawaii – ish.
The lower the latitude number, the closer it is to the equator. The higher the number, the closer it is to the North or South pole.
The lower the longitude number, the closer it is to Greenwich in the UK. The higher the longitude number – the closer it is to the middle of the Pacific Ocean.
Speed & Distance
1 Nautical Mile = 1852 metres. A nautical mile is 1 minute of Latitude. Latitude is marked on the left and right hand side of nautical charts. If you are taking distance measurements then you must remember to do this on the left or right hand side of the chart and not the top or bottom. The top and bottom of the chart is Longitude and longitude degrees do not equal 1 nautical mile.
A knot is 1 nautical mile per hour. A nautical mile is written as ‘M’
- Time = Distance ÷ Speed
- Speed = Distance ÷ Time
- Distance = Speed × Time
Time
When working out time, it is best to use the 24 hour clock. To convert 3.75 hours in to minutes:
- 3.75 hours = 3 hours + (0.75 x 60) mins
- = 3 hours 45 mins
To convert 45 minutes in to hours + decimal
- 0 + (45 ÷ 60) hours
- = 0.75 hours
Or 2 hours 15 minutes in to hours + decimal
- 2 + (15 ÷ 60) hours
- = 2.25 hours
Steering a Course
When reading a compass or describing a course, use three figures – i.e. 045º as opposed to 45º
- (C) means Compass, direction, course or bearing as per your compass reading
- (M) means Magnetic – means the compass reading once deviation has been accounted for (see below)
- (T) means True – meaning True north as per the chart once deviation and variation has been accounted for (see below)
- (R) means Relative (see below)
There are 360º on a compass. 000º through to 359º. You should always use three figures i.e. 090º. Compass directions should be rounded to the nearest degree.
There are 60′ or minutes in an arc
Then you get decimals of a minute.
For example: 56º25.7′
Variation
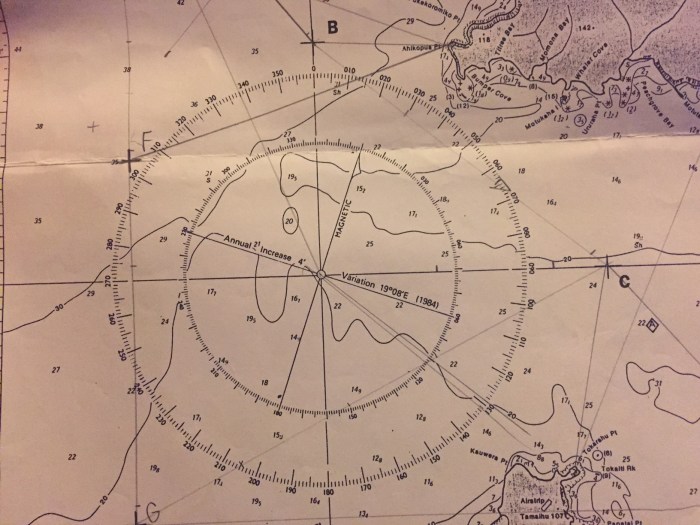
Did you know that Magnetic North moves around? The amount that it varies depends on your position on the earth, and it changes from year to year. So your magnetic compass points to Magnetic North, but all your charts are drawn with the aspect of True North. Variation is the difference between Magnetic North and True North. The Variation figure can be found on the compass rose on a chart.
All courses should be converted to True courses before being plotted on the chart.
In the example below. The Variation in 1984 was 19º08’E with an annual increase of 4′. So the difference between 2016 and 1984 is 32 years. 32 x 4′ = 128′. Divide that by 60 to get degrees and what ever is left over is the minutes so that is 2º 8′ and add that to the 19º08′ so the Variation now should be 21º16′
You can figure out whether to add or subtract the Variation from the compass reading with the wee rhyme below:
- Variation West, Compass Best
- Variation East, Compass Least
So that really means you add the Variation to the compass when it is East and you subtract it when it is West.
Deviation
Deviation is another compass error but this is caused by magnetic influences from the boat. You can read more about deviation and how to calculate it here.
So if you have a course you are steering on your compass you need to convert it from Compass to Magnetic and from Magnetic to True to get the True course and vice versa.
To remember the order in which to apply the Deviation and Variation, I remember it with the mnemonic: “Cadbury Dairy Milk Very Tasty” There is another one going back the other way which is “True Virgins Make Dull Company” – I think I prefer the chocolate one…
- Compass
- Deviation
- Magnetic
- Variation
- True
You can then do this in the opposite direction to convert a True course to a course to steer on your compass.
If variation and deviation are in the same direction, add them together. If they are in opposite directions subtract the smallest from the largest.
How to do it
- Plot your course on the chart
- Measure the true angle
- Apply variation
- Apply deviation
- This is the course to steer on your compass
If you are using a hand bearing compass you assume that there is no deviation – just don’t stand too close to any magnetic stuff if you can!
Relative Bearings
A Compass Bearing is the direction of the object taken from the boat when using a hand bearing compass. You assume that there is no deviation.
A Relative Bearing, is relative to the boat. So dead ahead is 000ºR and dead astern is 180ºR. If you take your True Course (that you are steering) and add the relative bearing then you get the true bearing.
To convert a relative bearing to a True bearing – add 360 and then take off the True heading.
Transit Bearing
A Transit Bearing is when two objects are seen exactly in line with each other. This means that your vessel lays somewhere on this line. Transit bearings are the fastest most accurate way of determining a position line as no calculations are necessary (Yay!!) You do not need to apply variation or deviation. Leading lights are a good example of transit bearings. When a pair of leading lights appear in transit, they form a line along which the vessel should travel.
You can also have light sectors where usually red lights indicate an area of danger – or the port side of a channel for example.
You can use Transit bearings to measure your compass deviation.
Clearing Bearings
Clearing bearings maintain safe passage past an obstruction and they do require variation and deviation to be applied. Clearing marks have no bearing, they guide you past an obstruction by maintaining a visual guide.
Radar Bearing
Radars can either be stabilized and linked to a compass, or un-stabilized and 000º is the direction in which the vessel is heading – i.e. head up.
Head up display will only give you relative bearings – i.e. in relation to where you vessel is heading.
EBL is an electronic bearing line. You can track your relative motion travelling past a landmark. You can use the range lines to see if you are drifting closer to the coast as you travel past and use this to ascertain any leeway. This is called Parallel Indexing.
Line of Soundings
This is another method of ascertaining your position. To be used in combination with another position fixing method.
- If you take a series of soundings while travelling in a straight line it is possible to match them to the chart.
- This is easier to do if the seabed has a distinctive shape – i.e. not a gentle slope.
- You need to make an adjustment for the height of the tide.
- You must also know the speed and distance travelled over the ground – not just through the water.
- Distance = time x speed
- Record the soundings over a period of time.
- Correct the soundings for the height of the tide and the depth of the transducer below the waterline
- Convert your compass course to a true course
- If there is any tidal current account for that and plot the true course and water movement to obtain a ground track and speed.
- Using speed and time intervals, calculate the distance travelled in M over the ground.
- Measure the distances on to the edge of a piece of paper using the latitude scale in nautical miles from your chart. Note the soundings and times against the appropriate time marks.
- Move the paper over the chart until the soundings match those on the chart
- The final sounding is your position at the time.
Wind and Tidal Streams – Ground Track
Wind affects the boats horizontal movement through the water but has little effect on the water itself. Tidal streams and currents are movements of water so they have to be considered separately.
Wind
Wind is expressed in the direction from which it is blowing from. I.e. a Southerly wind is coming from the South.
At sea wind speed is measured by an anemometer, or by its effect on the sea and referring that to the Beaufort wind scale.
Wind speed is measured in a few different ways: knots, meters per second, km per hour, or as a force on the Beaufort scale.
If the wind is blowing from directly ahead or astern the boat’s speed will be affected but it will not affect your course. If the wind is blowing from the side of the boat it will move the boat sideways from its intended track.
The side of the boat facing the wind is called the Windward side. The side away from the wind is the leeward side.
Leeway
The difference between the course you are steering and the course the boat is travelling through the water is called the leeway angle.
The leeway angle is always measured from the vessels true course. It varies depending on the strength of the wind, the shape of the boat (windage), and the relative wind direction. The closer the relative wind direction is to the boat’s beam, and the stronger the wind, the greater the leeway angle will be.
The water track is always downwind of the boats true course.
The only way to measure the true effects of the wind is by observation and experience. The boat’s wake can provide some clues to the water track.
Speed through the water
The log measures the boat speed through the water. Log speed does not include the effects of a head on or following tide. Some logs can also calculate ground speed.
Tides are the vertical movement of water. This movement also causes horizontal movement called tidal streams. This is measured in:
- Set – the direction the water is moving
- Rate – the speed
- Drift – distance over a given time – time x rate = drift
As the tide rises the inward flow of water is called a flood tide. It is displayed by an arrow with feathers on it.
The outward flow is the ebb tide – an arrow with no feathers.
Slack water is the interval in between the two streams.
Tidal streams are sometimes measured and there may be a tidal diamond on the chart with further information displayed in the corner of the chart. It will tell you the direction and speed (in kts) of the tidal stream. Sp stands for spring tide and Np stands for Neap tide.
For example: You are on a trip that takes you close to a tidal diamond on the chart. You estimate that you are going to be at that location at 12.30 on Friday 23 June. You want to find out the direction and rate of tide at that location at that time.
- Find the time of high water at the port listed on the tidal diamond information
- How many hours before or after high tide are you going to be at that location?
- Read down the table for hours before or after and then across the row to find the direction and rate at that time.
Note that the tidal direction is the direction that it is flowing TOWARDS. They are also always true directions.
Swells, rivers after rain, low pressure systems can effect the tides. Tides can also create overfalls, eddies and rips/races – i.e. disturbed water. Which can make navigating in these areas difficult.
Currents are a continuous flow in one direction and are displayed with a wiggly arrow. Currents are described in the direction they are flowing – so a Southerly wind and a northerly current are both heading in the same direction.
Imagine you are at an airport. You are walking at a normal pace – this is like your speed through the water. When you get on to a travelator your speed through the water doesn’t change, but your speed across the ground does – you go rapidly faster over the ground, but your actual walking speed hasn’t changed. The travelator is like the current.
GPS will calculate your speed relative to the ground.
- The measurement of direction and speed is known as a vector.
- The plotted course is the distance and direction travelled through the water.
- The course made good is the direction and distance travelled in relation to the ground.
- The set and drift is the direction and speed of the tide or current
- The three vectors will always form a triangle (God I wish I’d paid more attention at school!)
OK so here is how you do it…
- Plot the course on the chart and the actual position at which you would be if there were no drift.
- Sail in that direction for that allotted period of time.
- Now plot the actual position you reached at the end of that time period.
- Join the two lines together to make a triangle – the plotted position and the actual position you got to
- This is the direction and distance the vessel has been offset by the stream or current.
Position Fixing
- Always use the method that uses the greatest accuracy
- Try combining different methods, radar, navigational lights, depth soundings, bearings, & GPS
- Use objects closest to you
- Ensure you correctly identify the landmarks you are using
- If two or more position lines are obtained at the same time, the boat is located on the intersection of the two lines.
- To identify a fix. Circle it on the chart and put a dot at the fix and the time beside it.
- An ideal angle of cut is 90º, a poor angle is 30º
- A third position line provides an accuracy check. If a cocked hat appears, then the boat is somewhere within the triangle. This could be caused by a plotting error, calculation error, an incorrectly identified landmark, boat movement, instrument errors or chart errors.
- If the triangle is large, then the boat should be assumed to be in the most dangerous position and a new fix needs to be obtained ASAP.
- When sailing during the day visual bearings are best combined with radar, transits, depth soundings and vertical or horizontal sextant angles.
- At night raising and dipping lights, radar ranges and depth soundings can be used.
- Maintain regular intervals between position fixes i.e. every 10 or 30 minutes. This makes your boat speed calculations easier to do. However if an opportunity arises for fixing your position, don’t pass it up.
- If you are close to the coast or in poor visibility, position fixes should be more regular.
- Note your position when anchoring – as a useful way of checking if you are dragging anchor and also if you have to slip your anchor and need to come back to retrieve it later.
- Ded-reckoning can be used when offshore. Along with Celestial Navigation.
- Practice using these skills and then check your GPS to verify your accuracy. Then if you lose your GPS you’ve got the skills and tools to navigate without it.
Expressing Your Position
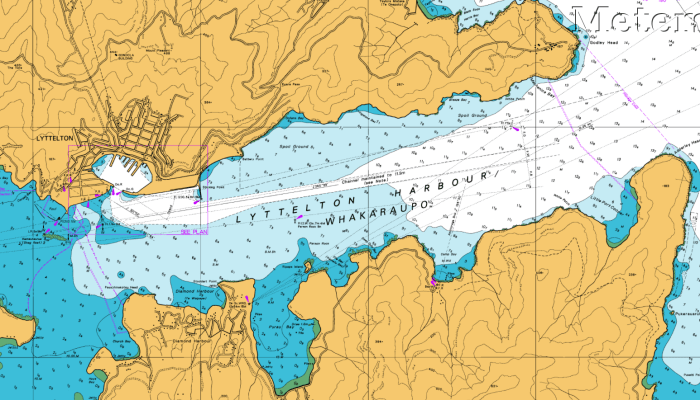
When you are describing your position to someone over the radio, you can express it in Latitude and Longitude or Bearing and Distance.
When using a bearing you should express your position to or from that landmark in True.
For example – if we were aproaching the Lyttelton Harbour entrance, we would say that we were two nautical miles North East of Godley Head (as opposed to expressing it as a distance & bearing from your boat – where Godley Head would be two nautical miles South West of your position) Expressing your location in this way means that people can go straight to the landmark on the chart and then plot your position from there, as opposed to trying to do it backwards…
Reading Chart Depths
Chart Datum is the level on the chart at which depths are measured from. It is usually the level of the lowest astronomical tide. So generally, depending on the tide, there is usually always more water above the level on the chart – so it is really a worst case scenario level of water.
Overhead obstacles like bridges are measured from a different level – mean high water springs – or the highest astronomical tide. This means that there is usually less water (or more clearance) available, depending on the tide.
To work out the height of the tide click here.
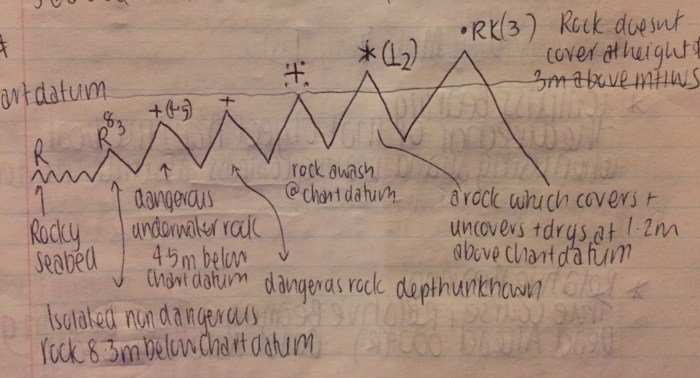
Charts provide all sorts of valuable information for sailors. One of the very important things is detailing hazards below the water that you can’t necessarily see. They are indicated on the chart as follows:
Rocks that are either just below the water line, or that cover and uncover with the tide are marked as follows:
- + = dangerous rock depth unknown
- + (4.5) = dangerous rock 4.5m below chart datum
- + with spots around the outside = a rock awash at chart datum (so usually just under the water at low tide)
- * (1) = a rock which covers and uncovers and drys at 1m above chart datum. (so if its low-low tide its usually protruding 1m above the water, but if there is 2m of tide above it, then it would be below the water)
- • Rk(3) = this rock doesn’t cover. It is at a height of 3m above MHWS (so at least 3m of it shows above the water at high tide)
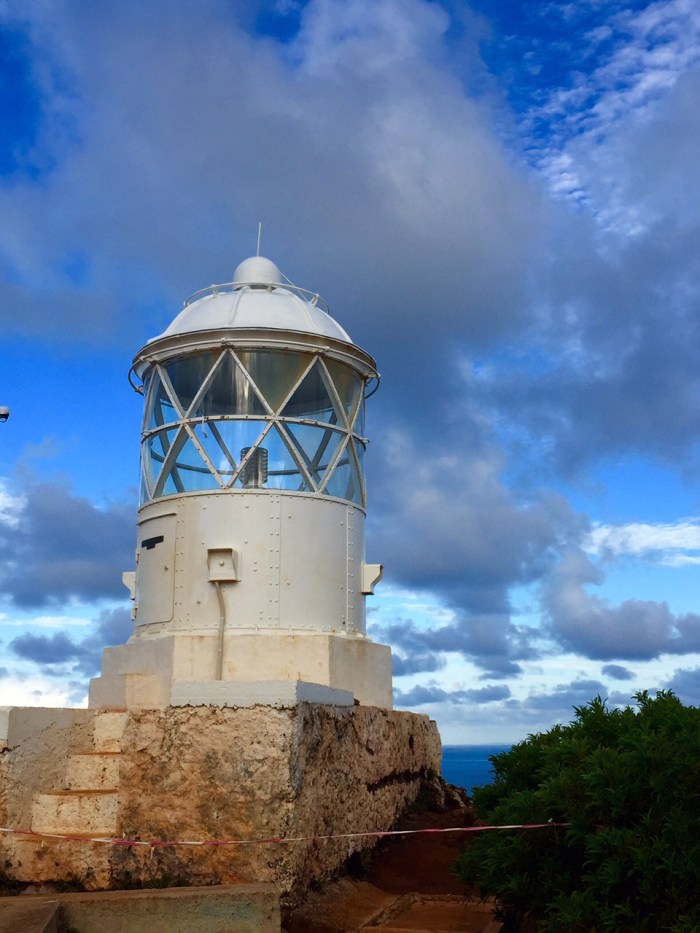
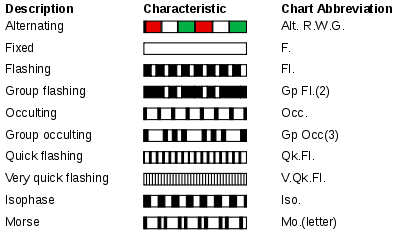
Light Houses
Lighthouses are described on the chart. Their different flashing signals allow you to identify which light you are looking at. You can use lighthouses to take bearings from, raise or dip them over the horizon and during the day use them for measuring vertical sextant angles.
With GPS being so easy to use these days, it is really easy to not use these traditional navigation techniques. Do you still use paper charts and manually plot your course?
Tune in next time when I talk about position lines!
To learn more useful navigation techniques check out my posts on calculating distance off by vertical sextant angle, horizontal sextant angle and raising and dipping lights and landmarks.


I’m still following along!
LikeLike
I love reading your posts. I’m prepping for my captains license and your lessons are getting me ready for what I will be covering soon! Thanks
LikeLike
Yay great! Please feel free to chip in with any comments of things you learn and techniques etc too. Its great to share ideas and I love hearing that the posts are useful for other people as well. Good luck with your course! 🙂
LikeLike
Pingback: Coastal Skipper | Astrolabe Sailing
Pingback: Celestial Navigation- Measurement of Time | Astrolabe Sailing
Pingback: Navigation – Position Lines | Astrolabe Sailing
Pingback: RYA Offshore Yachtmaster | Astrolabe Sailing